
Business-focused analytics • 150+ projects
Business-focused analytics • 150+ projects
Business-focused analytics • 150+ projects
Your dashboards look good.
But do they tell you what to do next?
Your dashboards look good.
But do they tell you what to do next?
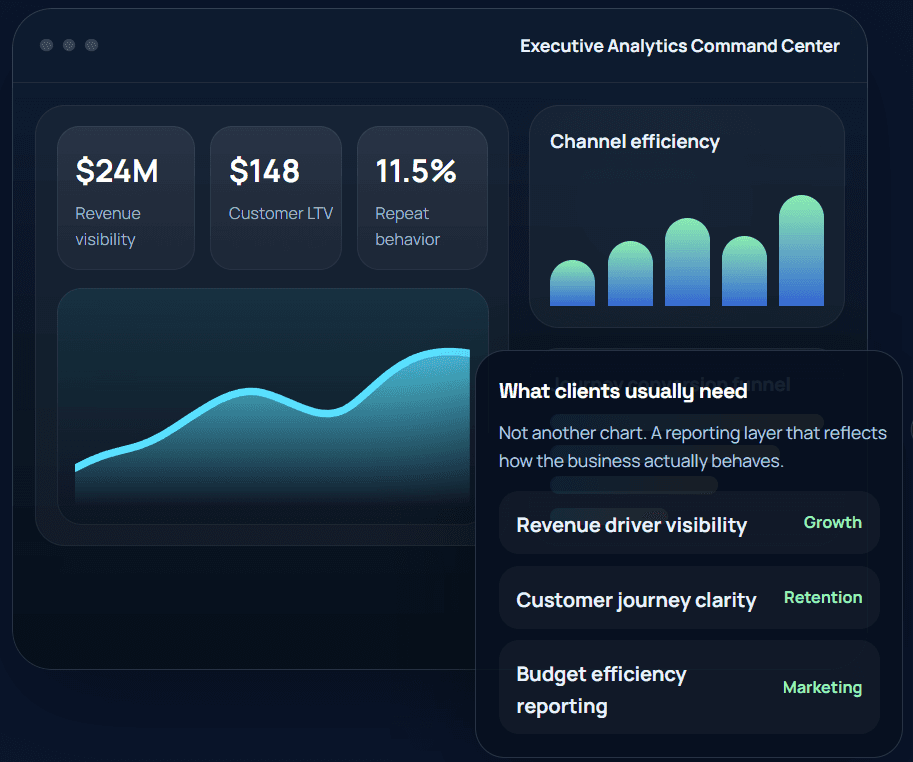
We help eCommerce, gaming and marketplace teams move from reporting outputs to the decisions those reports should be driving.
We help eCommerce, gaming and marketplace teams move from reporting outputs to the decisions those reports should be driving.
We help eCommerce, gaming and marketplace teams move from reporting outputs to the decisions those reports should be driving.

Built across the platforms your teams already use
We work with Power BI, Tableau, SQL, Python, Looker, and related BI workflows — but the real value is in how the reporting logic is designed around business decisions.
We work with Power BI, Tableau, SQL, Python, Looker, and related BI workflows — but the real value is in how the reporting logic is designed around business decisions.
Power BI
Power BI
Tableau
Tableau
SQL
SQL
Python
Python
Looker
Looker
Metabase
Metabase
Snowflake
Snowflake
Databricks
Databricks
Core Expertise
Core Expertise
Core Expertise
Where analytics directly drives revenue decisions
Where analytics directly drives revenue decisions

01
01
Gaming platform analytics
Gaming platform analytics
Identify revenue-driving segments, player behavior, and drop-offs impacting monetization.
Identify revenue-driving segments, player behavior, and drop-offs impacting monetization.
02
02
Ticketing platform analytics
Ticketing platform analytics
Understand demand patterns, event performance, and revenue concentration across channels.
Understand demand patterns, event performance, and revenue concentration across channels.
03
03
Customer journey analytics
Customer journey analytics
Track cross-platform behavior, retention drivers, and LTV differences across segments.
Track cross-platform behavior, retention drivers, and LTV differences across segments.
04
04
Multi-channel marketing analytics
Multi-channel marketing analytics
Measure true channel performance and optimize budget allocation using attribution insights.
Measure true channel performance and optimize budget allocation using attribution insights.
Featured Case Studies
Featured Case Studies
Selected work built around real business questions

+23% repeat purchases: ~$200K revenue opportunity surfaced (60K+ orders).
Gaming Platform Analytics
End-to-End Gaming Platform Analytics, Risk Monitoring & Revenue Intelligence
Built a comprehensive analytics system covering player behavior, transactions, game performance, and anomaly detection.
Detected anomalies and suspicious transactions
Tracked player lifecycle and engagement
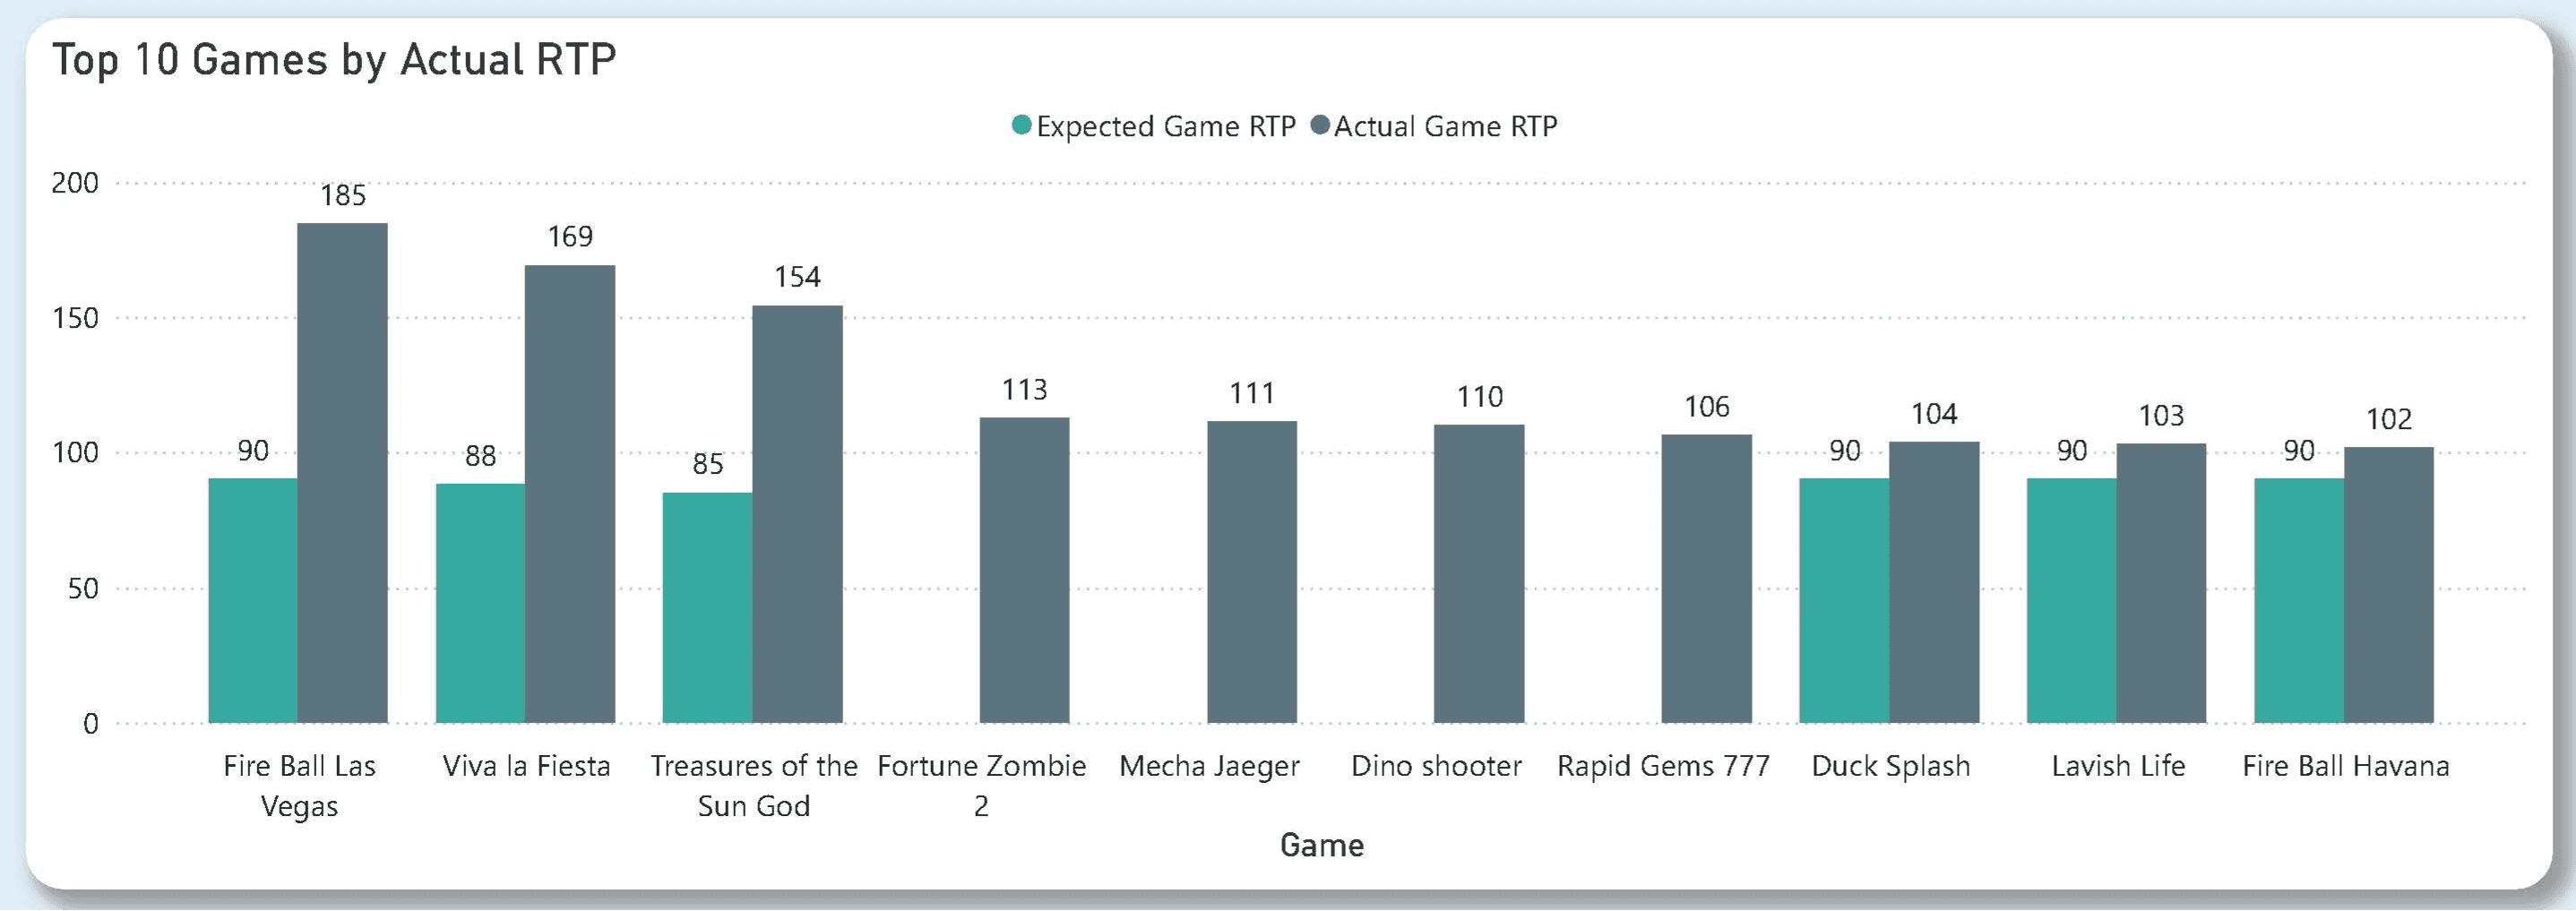
Monitored PnL, RTP, and game performance
Helped identify potential revenue leakage and unusual activity patterns
+23% repeat purchases: ~$200K revenue opportunity surfaced (60K+ orders).
Gaming Platform Analytics
End-to-End Gaming Platform Analytics, Risk Monitoring & Revenue Intelligence
Built a comprehensive analytics system covering player transactions, game performance, and anomaly detection.
Detected anomalies and suspicious transactions
Tracked player lifecycle and engagement
Monitored PnL, RTP, and game performance
Helped identify potential revenue leakage and unusual activity patterns
+23% repeat purchases: ~$200K revenue opportunity surfaced (60K+ orders).
Gaming Platform Analytics
End-to-End Gaming Platform Analytics, Risk Monitoring & Revenue Intelligence
Built a comprehensive analytics system covering player behavior, transactions, game performance, and anomaly detection.
Detected anomalies and suspicious transactions
Tracked player lifecycle and engagement
Monitored PnL, RTP, and game performance
Helped identify potential revenue leakage and unusual activity patterns


$934K in anomalous bets flagged. player-lifecycle + anomaly detection
Customer Journey Analytics
Customer lifecycle & retention analytics for eCommerce
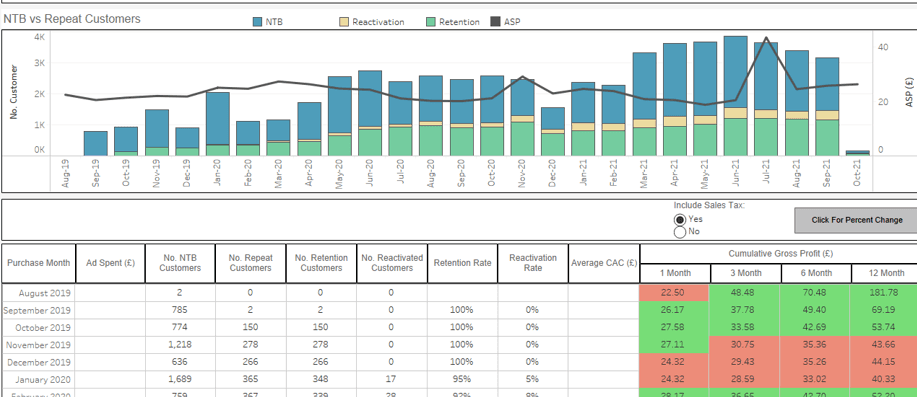
Built a customer analytics framework to track lifecycle, retention, and long-term value across multiple platforms.
Analyzed 60K+ orders to reveal repeat buys & churn points
Found customer journeys & product affinities for smarter targeting
Built cohort-based LTV tracking across 12-month periods
Improved decisions on retention, CLV & marketing ROI
$934K in anomalous bets flagged. player-lifecycle + anomaly detection
Customer Journey Analytics
Customer lifecycle & retention analytics for eCommerce
Built a customer analytics framework to track lifecycle, retention, and long-term value across multiple platforms.
Analyzed 60K+ orders to reveal repeat buys & churn points
Found customer journeys & product affinities for smarter targeting
Built cohort-based LTV tracking across 12-month periods
Improved decisions on retention, CLV & marketing ROI
100K+ users analysed; 0.14% conversion gaps pinpointed.
Ticketing Platform Analytics
End-to-end analytics for a global ticketing platform
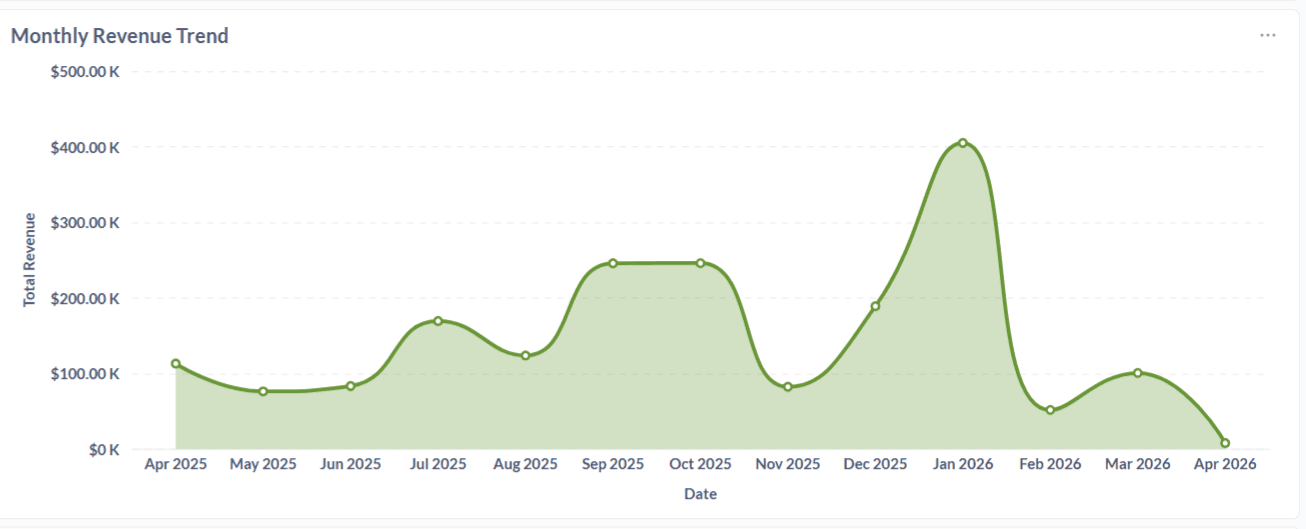
Built a unified analytics layer across revenue, ticket sales, user behavior, and forecasting.
Identified key revenue drivers and event performance contributing to major revenue concentration
Uncovered conversion gaps with rates as low as 0.14% despite high traffic (100K+ users)
Enabled forecasting and performance tracking to support better planning decisions
100K+ users analysed; 0.14% conversion gaps pinpointed.
Ticketing Platform Analytics
End-to-end analytics for a global ticketing platform
Built a unified analytics layer across revenue, ticket sales, user behavior, customer retention, and forecasting to help teams make faster data-driven decisions across multiple markets and live events.
Identified key revenue drivers and event performance contributing to major revenue concentration
Uncovered conversion gaps with rates as low as 0.14% despite high traffic (100K+ users)
Enabled forecasting and performance tracking to support better planning decisions
100K+ users analysed; 0.14% conversion gaps pinpointed.
Ticketing Platform Analytics
End-to-end analytics for a global ticketing platform
Built a unified analytics layer across revenue, ticket sales, user behavior, and forecasting.
Identified key revenue drivers and event performance contributing to major revenue concentration
Uncovered conversion gaps with rates as low as 0.14% despite high traffic (100K+ users)
Enabled forecasting and performance tracking to support better planning decisions
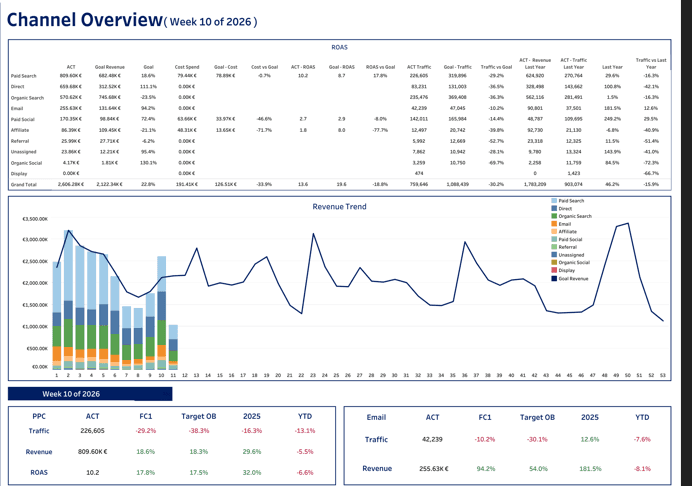
6+ channels unified. into one source of truth for attribution & spend decisions
Multi-channel Marketing
Multi-Channel Marketing Performance & Budget Optimization
Built a marketing analytics framework to track channel performance.
Validated attribution accuracy and optimized budget allocation.
Unified revenue, traffic, and ROI to scale top channels.
Cross-channel attribution analysis (Attributed vs Last-touch revenue)
Revenue vs target tracking with performance benchmarking
Budget optimization insights to improve spend efficiency
6+ channels unified. into one source of truth for attribution & spend decisions
Multi-channel Marketing
Multi-Channel Marketing Performance & Budget Optimization
Built a marketing analytics framework to track channel performance.Validated attribution accuracy and optimizes budget allocation.Unified revenue, traffic, and ROI to scale top channels.
Cross-channel attribution analysis (Attributed vs Last-touch revenue)
Revenue vs target tracking with performance benchmarking
Budget optimization insights to improve spend efficiency
6+ channels unified. into one source of truth for attribution & spend decisions
Multi-channel Marketing
Multi-Channel Marketing Performance & Budget Optimization
Built a marketing analytics framework to track channel performance.
Validated attribution accuracy and optimized budget allocation.
Unified revenue, traffic, and ROI to scale top channels.
Cross-channel attribution analysis (Attributed vs Last-touch revenue)
Revenue vs target tracking with performance benchmarking
Budget optimization insights to improve spend efficiency
Additional Case Studies
Additional Case Studies
Additional Case Studies
Broader analytics work beyond the main four
Operations & SLA dashboards
Operations & SLA dashboards
Ticket volume, breaches, service performance, and action-oriented monitoring.
Ticket volume, breaches, service performance, and action-oriented monitoring.
Sustainability / ESG reporting
Sustainability / ESG reporting
KPI dashboards for environmental and performance monitoring initiatives.
KPI dashboards for environmental and performance monitoring initiatives.
Logistics & inventory analytics
Logistics & inventory analytics
Operational tracking, forecast views, stock movement, and planning visibility.
Operational tracking, forecast views, stock movement, and planning visibility.
Funnel & conversion analytics
Funnel & conversion analytics
Drop-off analysis, stage-level performance, and lead movement visibility.
Drop-off analysis, stage-level performance, and lead movement visibility.
Education dashboards
Education dashboards
Student performance tracking, cohort insights, and academic KPI reporting.
Student performance tracking, cohort insights, and academic KPI reporting.
Executive dashboards
Executive dashboards
High-level KPI reporting built for leadership teams and faster decisions.
High-level KPI reporting built for leadership teams and faster decisions.
Testimonials
Testimonials
What clients say about the work
What clients say about the work
“
“
Highly skilled in building insightful dashboards and optimizing BI performance.
Highly skilled in building insightful dashboards and optimizing BI performance.
Highly skilled in building insightful dashboards and optimizing BI performance.
Director of Data Services @ UPG Enterprises
Director of Data Services @ UPG Enterprises
Director of Data Services @ UPG Enterprises
View Full Testimonial
View Full Testimonial
“
Takes full ownership and consistently delivers high-quality BI dashboards.
Takes full ownership and consistently delivers high-quality BI dashboards.
Takes full ownership and consistently delivers high-quality BI dashboards.
Senior Manager Data Management @ iQuanti
Senior Manager Data Management @ iQuanti
Senior Manager Data Management @ iQuanti
View Full Testimonial
View Full Testimonial
“
Transformed complex data into actionable dashboards used daily by marketing teams.
Transformed complex data into actionable dashboards used daily by marketing teams.
Transformed complex data into actionable dashboards used daily by marketing teams.
Managing Director @ AMPC
Managing Director @ AMPC
Managing Director @ AMPC
View Full Testimonial
View Full Testimonial
About
Built around business clarity, not just dashboard delivery
NMK Infotech focuses on helping businesses identify what is actually driving performance. That means looking beyond totals and top-line KPIs to uncover where revenue comes from, where dependency exists, and where better decisions can be made.
NMK Infotech focuses on helping businesses identify what is actually driving performance. That means looking beyond totals and top-line KPIs to uncover where revenue comes from, where dependency exists, and where better decisions can be made.
Led by Sadat Khan
Led by Sadat Khan
Sadat Khan is a Data Analytics Consultant with 10+ years of experience delivering analytics and dashboard solutions across e-commerce, marketing, gaming, and business intelligence.
Sadat Khan is a Data Analytics Consultant with 10+ years of experience delivering analytics and dashboard solutions across e-commerce, marketing, gaming, and business intelligence.
Experience & proof
Experience & proof
150+ projects delivered across multiple industries with tools including Power BI, Tableau, SQL, Python, Metabase, and business-focused reporting systems.
150+ projects delivered across multiple industries with tools including Power BI, Tableau, SQL, Python, Metabase, Snowflake, Databricks and business-focused reporting systems.
How We Work
How We Work
01
Discovery call (free, 30 min)
We map your data and the decisions you need it to drive
02
Scoped proposal
Delivered within a few business days, with clear outcomes and timeline
03
Build & handover
Dashboards your team can act on, plus support to adopt them.

Need clarity from your data?
If your dashboards look busy but decisions still feel unclear, you're missing the drivers behind your numbers.
If your dashboards look busy but decisions still feel unclear, you're missing the drivers behind your numbers.
If you already have data but need clarity on what it is saying, we can help.
If you already have data but need clarity on what it is saying, we can help.
Need clarity from your data?
If your dashboards look busy but decisions still feel unclear, you're missing the drivers behind your numbers.

See how we solve this
If you already have data but need clarity on what it is saying, we can help.

Contact
Based in India (IST), working with clients across Europe, North America and Asia — flexible scheduling
Let’s talk about the reporting problem behind the dashboard request.
Tell us what you are trying to improve, we'll come prepared and share a focused plan during the call.
info@nmkinfotech.com
Prefer to Message?
WhatsApp +917338759046 (IST, Mon–Fri)

Get In Touch
Send an Enquiry
Get In Touch
Send an Enquiry
Get In Touch
Send an Enquiry
Frequently Asked Questions
How long does an engagement take?
Most run 2–6 months; some are short, fixed-scope builds.
Do you replace our tools or work with them?
We work with your existing tools (Power BI, Tableau, etc.).
Do you handle raw data or just visuals?
Both — from data prep to the final dashboard.
Can you work with our internal team?
Both — from data prep to the final dashboard.
What does the free consultation cover?
A 30-minute call to understand your needs; no obligation.
How is pricing structured?
Project-based or retainer; we scope it after the first call.
How quickly do you respond?
Within 1 business day.

NMK Infotech
Decision-focused analytics and dashboard consulting
Decision-focused analytics and dashboard consulting
© 2026 NMK Infotech · Trading name of NMK Infotech Private Limited.
© 2026 NMK Infotech · Trading name of NMK Infotech Private Limited.
© 2026 NMK Infotech · Trading name of NMK Infotech Private Limited.